Statistics
Statistic tools are applied for experiment design, data analysis and visualization in sensomics and metabolomics research projects. To cope with the complex problems of multidimensional data sets, a wide range of descriptive and inferential statistical methods is used.
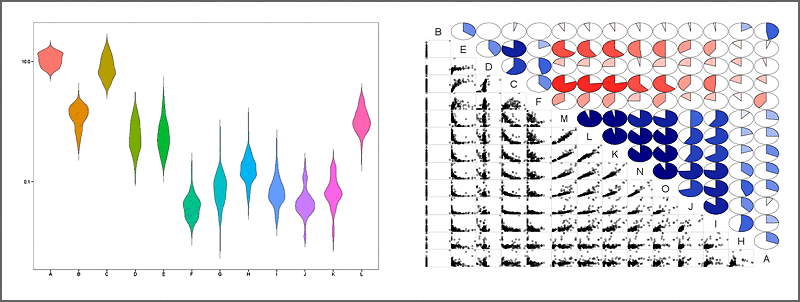
Descriptive statistics is used for summarizing and describing the main features of collections of data to learn about the population representing the data. Analysis of univariate data involves depicting the distribution of single variables (central tendency, dispersion, variance, skewness, kurtosis, histograms, boxplots), while bivariate analysis is used to describe the relationships between pairs of variables (correlation, covariance, scatterplots). The simultaneous analysis of multiple outcome variables of multivariate datasets leads to the understanding of the relationships between variables and their relevance (multivariate analysis of variance, multivariate regression, canonical correlation, factor analysis, principal component analysis, correspondence analysis, multidimensional scaling, discriminant analysis, artificial neural networks). Predictive methods model patterns in data sets in a way that accounts for randomness in the observations, followed by drawing interferences about processes and populations (regression, extrapolation, interpolation of time series, cluster analysis, classification, parametric and non-parametric models, bayesian inference)
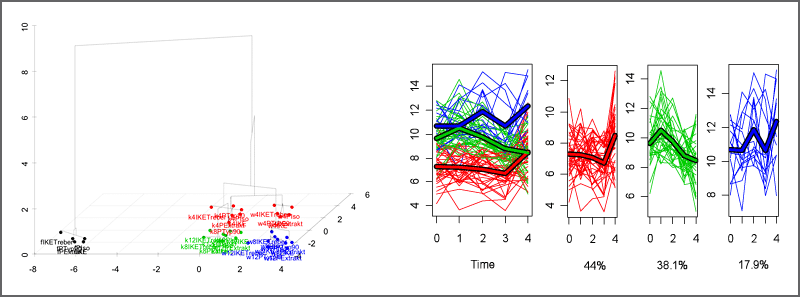
Chemometric methods are used to model properties of complex metabolomic and food systems to detect underlying relationships and structures and to predict new properties. Techniques applied include multivariate calibration, clustering, pattern recognition, multivariate discriminant analysis, rank reduction, multivariate curve resolution (self-modeling mixture analysis, spectral unmixing) and resampling (bootstrap, permutation, cross-validation).


